Module 2 · Data preprocessing for process data · Lesson 4
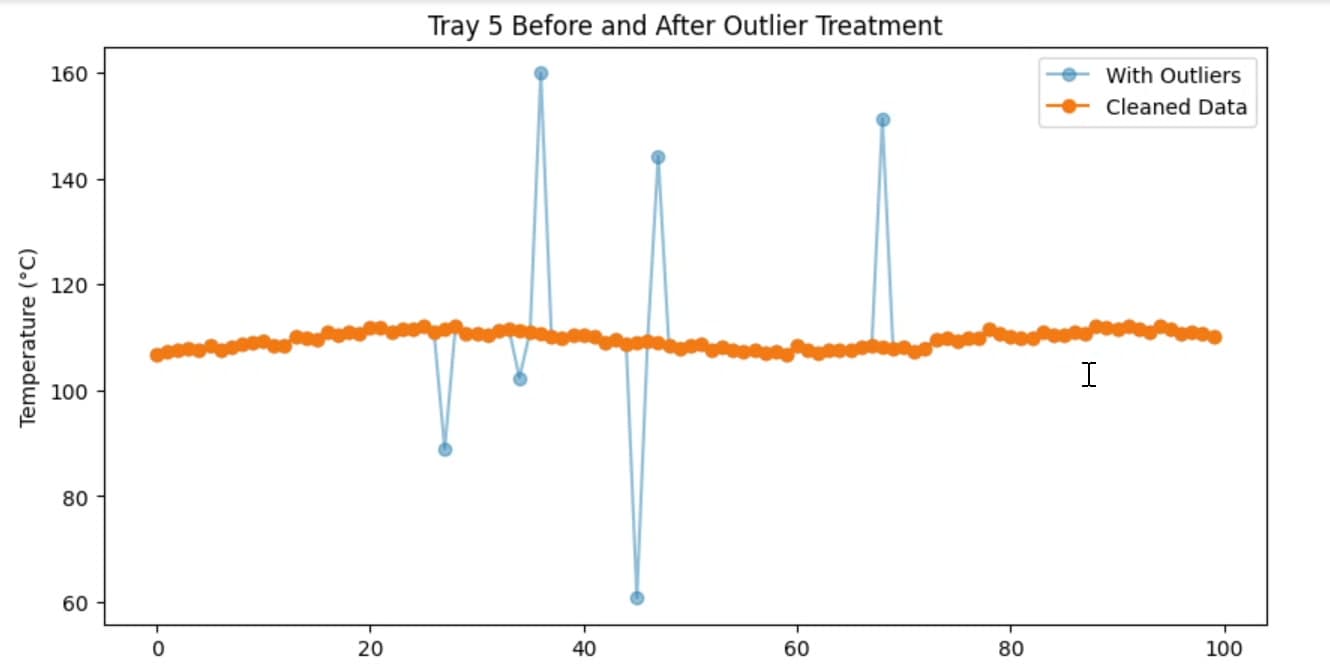
A distillation column logs a temperature on every tray. A few readings jump far from the rest, and a model trained on them learns those jumps as if they were real behavior.
Clean inputs come before any model. This lesson works through tray temperature data from a column, finds the readings that sit far from the rest, checks whether they belong to one instrument or to the whole column, and treats them before modeling.
Spot outliers with line plots and boxplots
Flag them with z-scores and the 1.5 × IQR rule
Replace bad readings and interpolate across the gaps
Find system-wide disturbances that show on many trays at once
One of 29 lessons in the 20-hour course, self-paced on Udemy.